By Campbell Spence
Spoiler Alert: Port Phillip council has significantly higher rates than neighbouring councils. Read below to understand why using average rates per property cannot be used to compare councils, and why more relevant metrics, such as unitising, reveal that a Council can be higher taxing.
Some groups in our community are claiming that rates in the City of Port Phillip (CoPP) are lower than neighbouring councils. Let’s fact check that, as it is important that you have the facts. The numbers below are based on 2019-20 Council budgets which are available in the public domain.
For the 2023-24 financial year, CoPP rates and charges continued to be much higher compared to Stonnington, Bayside and Glen Eira for a property of the same value. For example, the rates and charges for a house priced at $1.9M in CoPP are $3,483 which is $1,150 more than Stonnington, $1,000 more than Bayside and $580 more than Glen Eira. See https://ropp.org.au/property-rates-calculator/
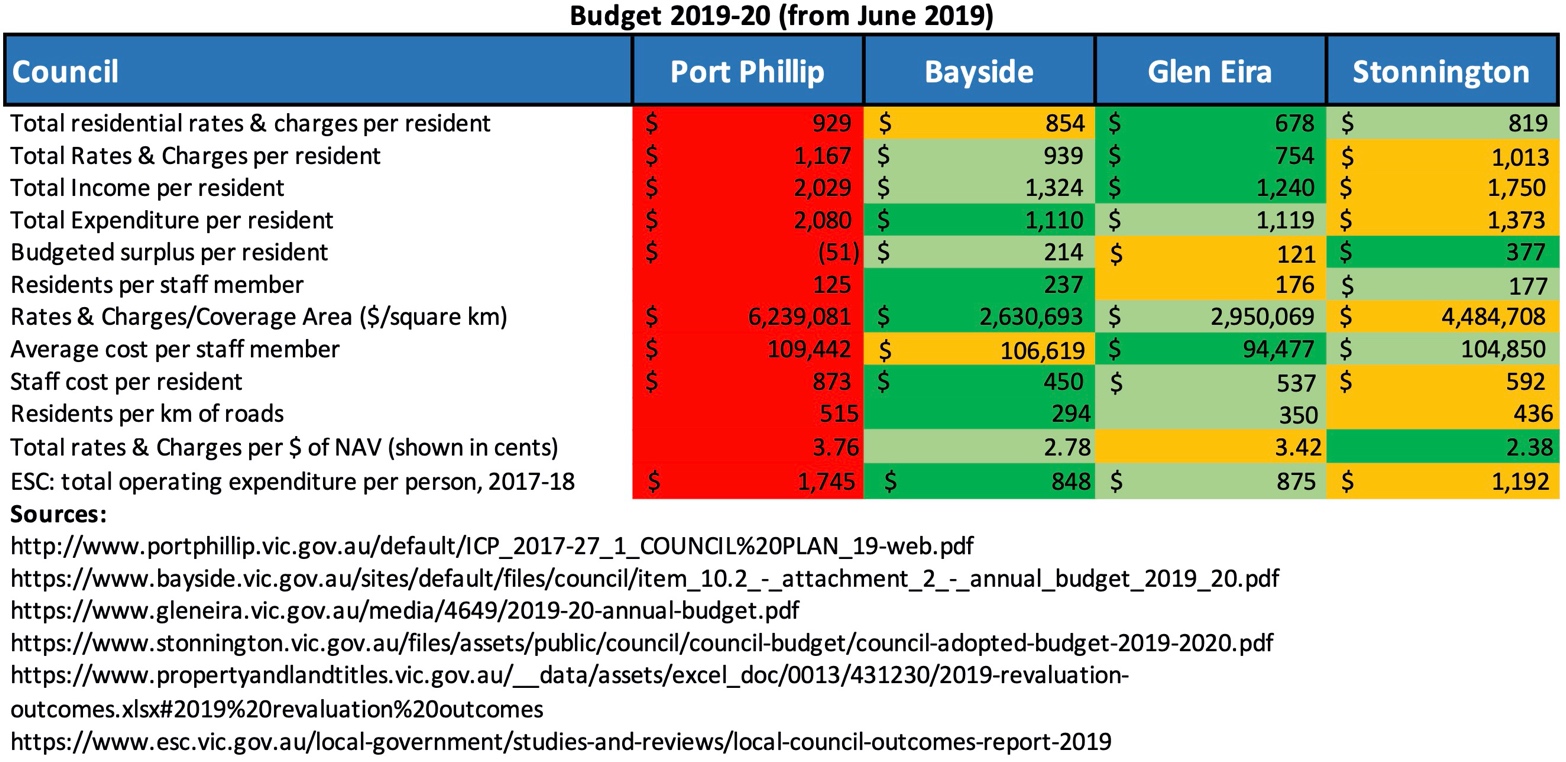
Firstly, let’s look at how much council collects in income. In 2019-20, CoPP collected $129 million in Rates and Charges, and $95 million in other charges such as fees, fines and grants. That’s much higher than neighbouring councils (See bar chart below: 2019-20 Total Income).
So, what is the reason for this? There are a few reasons why CoPP might need to collect higher rates, let’s look at each:
- Coverage area and length of local roads
- Population
- Total number of properties
1. Coverage area
The larger a municipality is, the more money it needs spent on maintaining roads, footpaths, parks, streetlights, stormwater pipes etc.
| City of Port Phillip | Bayside | Glen Eira | Stonnington |
Coverage area (square km) | 20.7 | 37.2 | 38.7 | 25.7 |
Rates ($mil) / km2 | $6.24 | $2.63 | $2.95 | $4.48 |
| | | | |
Length of local roads (km) | 215 | 355 | 433 | 261 |
Rates ($K)/ km | $602 | $276 | $264 | $442 |
Does this explain the high rates? No, it doesn’t.
CoPP has the smallest area and the shortest length of roads, but the highest rates.
CoPP spends more than double some neighbouring councils based on these metrics.
2. Population
Council services are most fairly compared based on population. This is because council provides services like libraries, parks, activity centres, childcare, customer service centres, parking permits etc. based on how many people they need to service.
| City of Port Phillip | Bayside | Glen Eira | Stonnington |
Population | 110,634 | 104,274 | 151,439 | 113,737 |
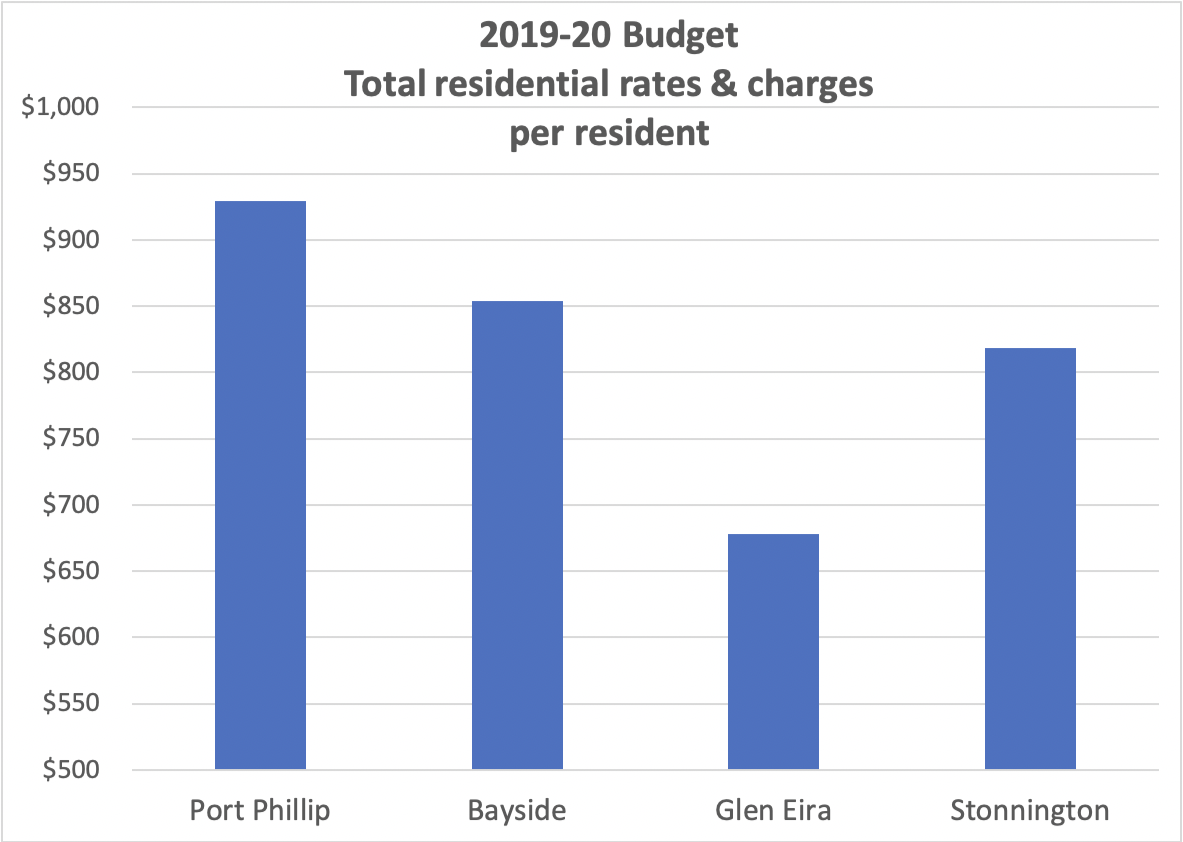
Does this explain the high rates? No, it doesn’t.
CoPP has higher rates and charges per resident than neighbouring councils, and there is an interesting reason for that.
CoPP employ more staff than neighbouring councils and pay their staff more than neighbouring councils.
The cost to ratepayers was in that year, almost $100 million:
| City of Port Phillip | Bayside | Glen Eira | Stonnington |
Staff numbers (FTE) | 883 | 440 | 860 | 642 |
Average staff cost | $109,442 | $106,619 | $94,477 | $104,850 |
Total staff cost | $96.6 million | $46.9 million | $81.3 million | $67.3 million |
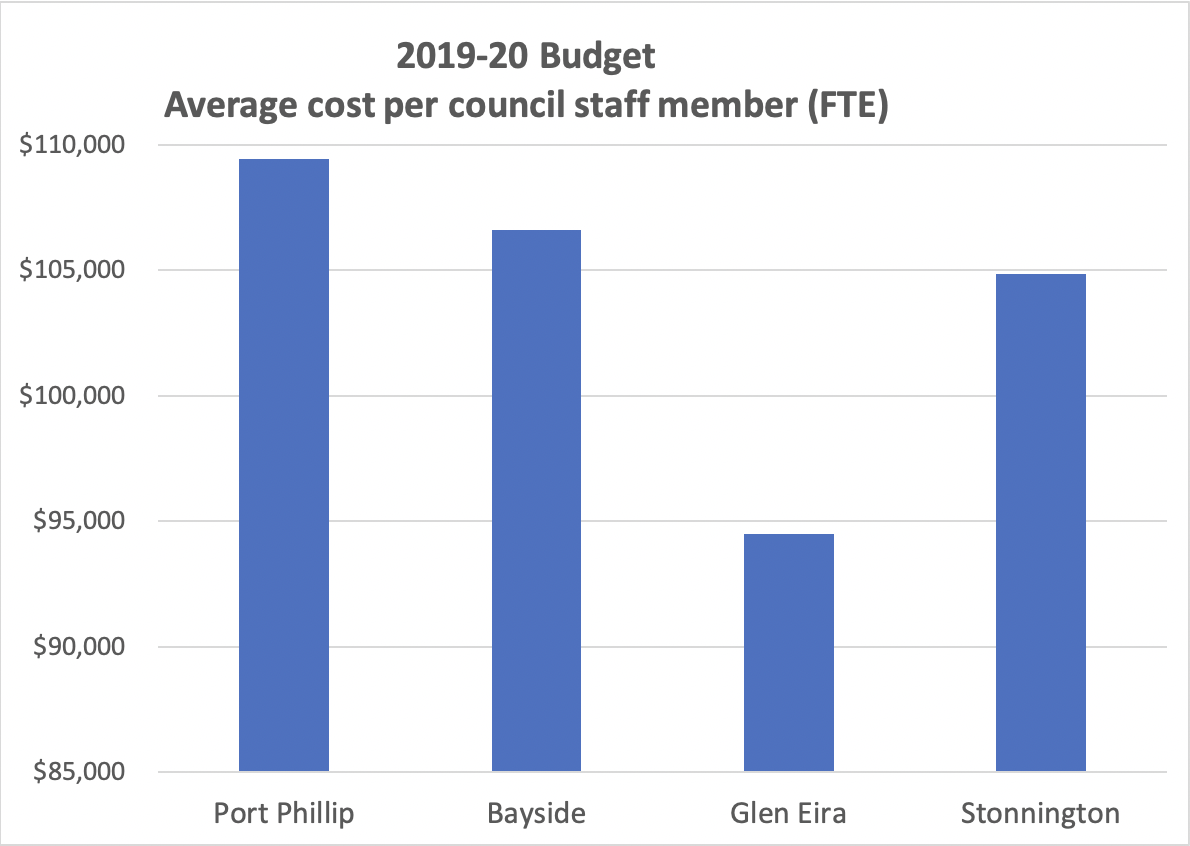
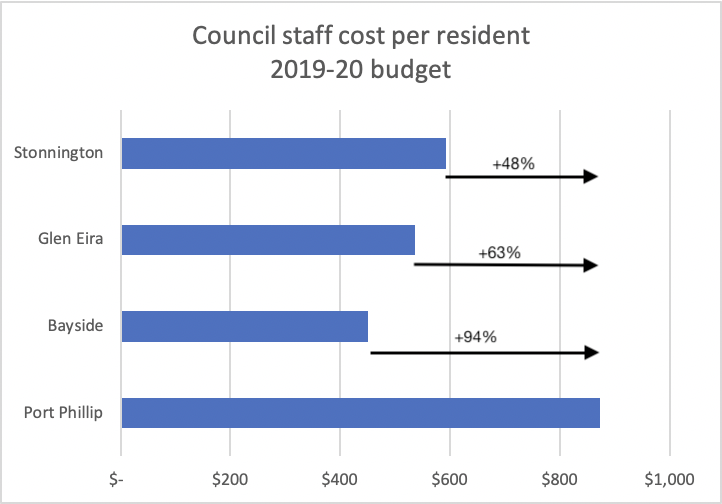
Each resident in the CoPP pays $873 for Council staff costs, whereas for the other three councils, the cost ranges from $450-592. (See figures above.)
The CoPP say that this is because they choose to provide services that others may not. And yes, one may agree to an extent.
CoPP states that the extra staff they employ are for Council-run childcare centres, parking enforcement, for street / beach cleaning, and for teams to run South Melbourne Market and major festivals like St Kilda Festival. But even when these additional staff costs are removed, CoPP remains the most expensive council compared to its neighbours.
3. Total number of properties
For a minority of services, like collecting rubbish, the number of properties does influence cost. But in the CoPP, waste management only accounts for 5.3% of the total spend, according to the Essential Services Commission.
Some groups interested in keeping rates high, have claimed that average rates per property should be used to compare the rates charged by different councils. Let’s look at why that is not a valid way to compare rates (and why those groups use this metric to not properly inform the public):
Reason 1 – CoPP has a higher number of residential properties
We know that most services Council provides depend on the number of people they provide services to and the infrastructure they service (see sections above).
Using the average to compare rates between councils is fundamentally flawed.
Average residential rates are calculated using two elements:
- Total $ amount of residential rates charged
divided by - Number of residential properties.
So right away, we can see that a council with a higher number of residential properties will result in a lower average.
CoPP has a high number of residential properties. Or alternatively, you could say that there are less residents per property as shown in the diagram below labelled:
“2019-20 Budget: Average number of residents per residential property”.
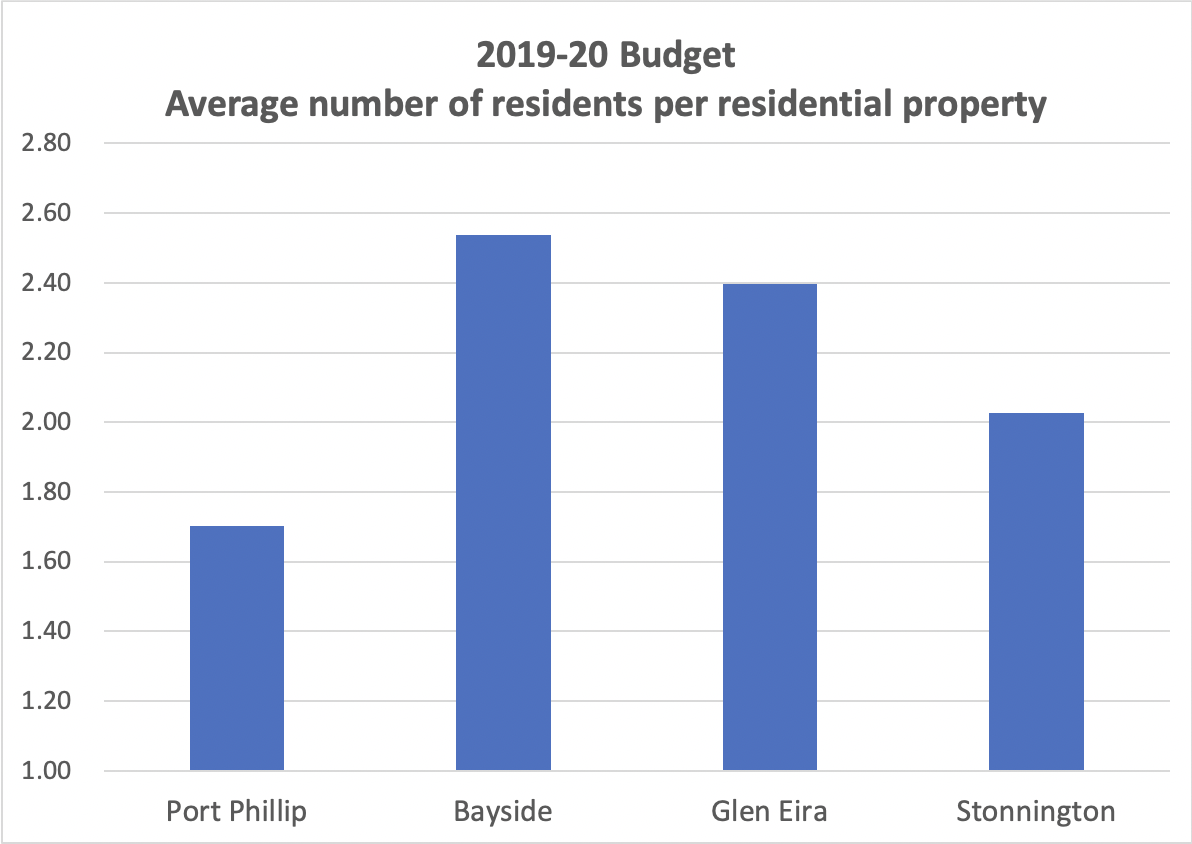
Whether residents live in large properties together, or in small properties alone, this doesn’t change the total amount of rates being charged by a council; it only changes the average rates per property.
Average residents per residential property is used here to show that average rates per property is not a good metric. Average residents per property by itself is not meaningful. That’s why average rates per property is a poor measure of whether council rates are comparatively high or low. The fact is, that given we have so many residential properties in a small area, rates should be a whole lot lower.
What then, is a fairer way to compare rates?
This is simple: on a unitised basis i.e. per population.
Two examples of unitised data (data per resident) are
- The chart above labelled: “2019-20 Budget Total residential rates and chargers per resident”
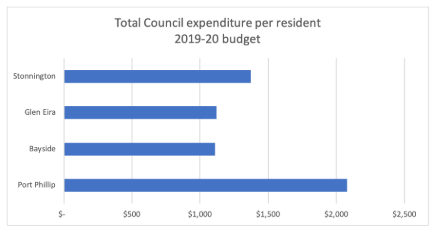
- The chart below labelled “Total Council expenditure per resident 2019-20 budget”
By unitising the data according to population size, both charts show CoPP has higher rates and chargers and expenditure per resident, whereas the average rates per residential property ignores the variables of different sized properties, different property values and different numbers of residents per property. By ignoring these variables, it means that the average rates per property is not a relevant metric when comparing councils.
Reason 2 – Not all properties are the same.
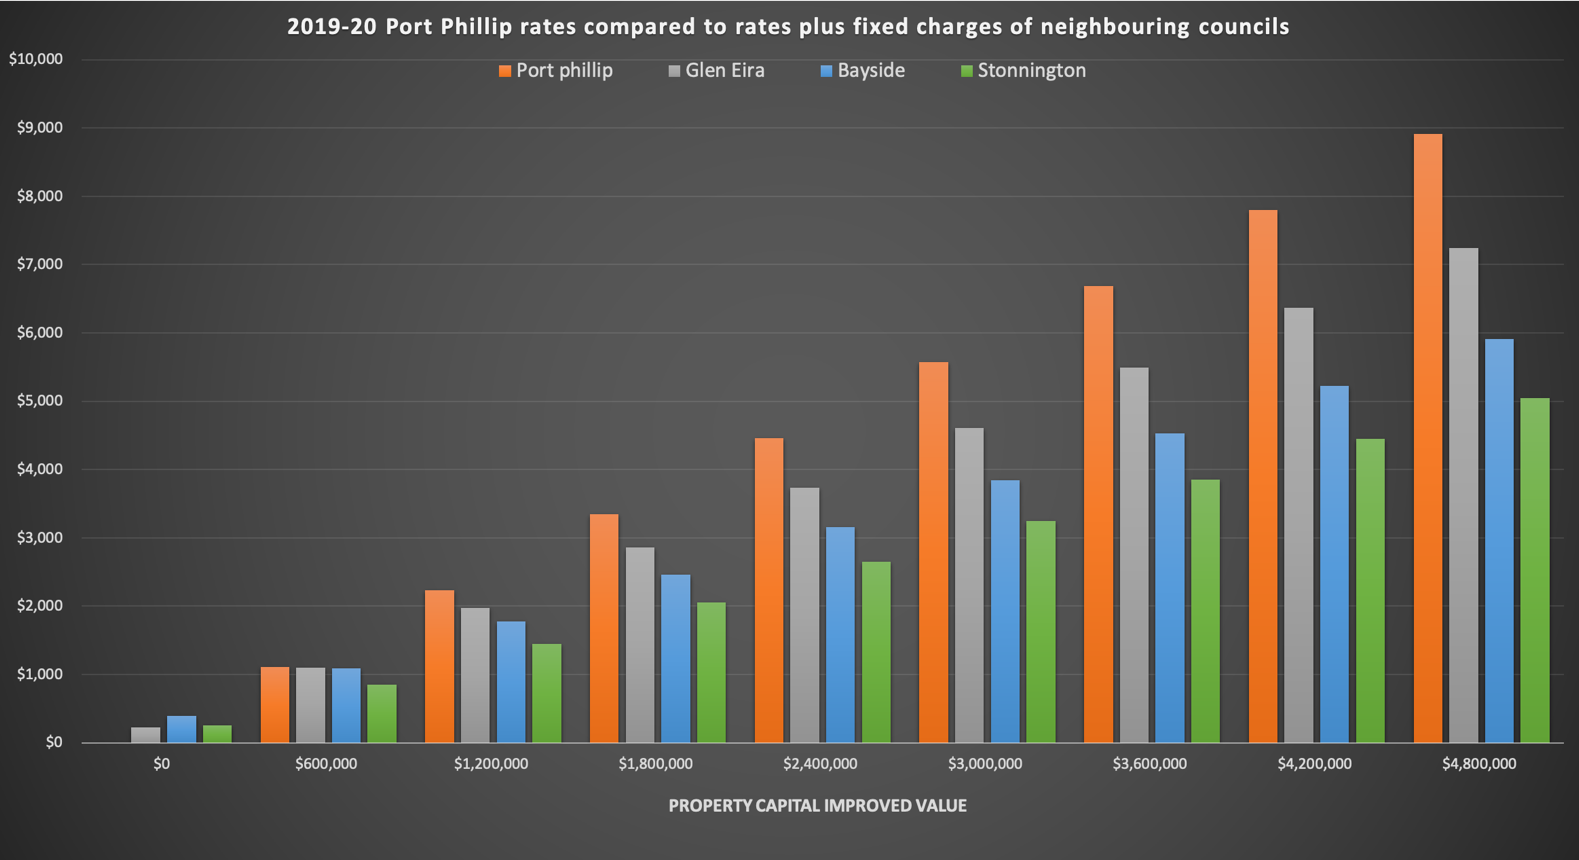
We have a progressive rates system whereby the level of rates you pay is proportional to your property value. While there are many small apartments paying rates like neighbouring councils, the brunt of high rates is borne by those with higher property values, many of whom may not have the propensity to pay (the value of your property does not always indicate your income).
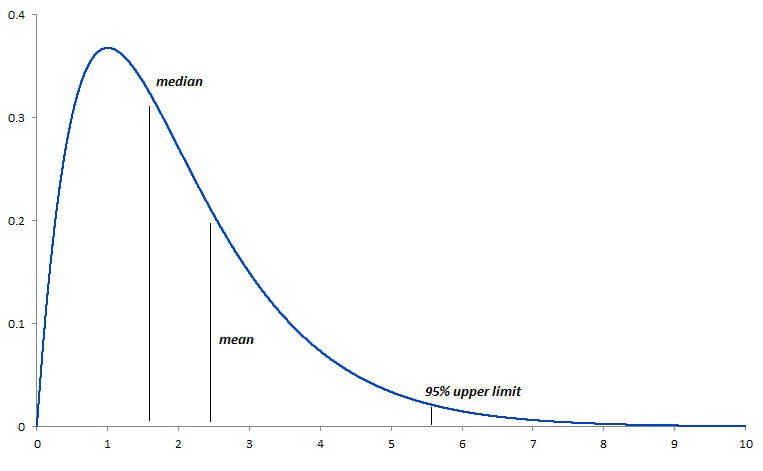
As stated earlier, the average residents per property by itself is meaningless. It is used here to show the statistical positive skew (see diagram below) and how averages work. The reason average rates in the CoPP are the same, or even slightly lower than neighbouring councils, is because of the positive skew in property values.
CoPP has many apartments which are lower in value than the median (middlemost) property value. The diagram below is an example of a positive skew. This results in a statistical deception – the average (mean) rates per property does not reflect why rates are so expensive overall, especially for many ratepayers in the CoPP.
As stated above, average rates per property ignores the variables of different sized properties, different property values and different numbers of residents per property. By ignoring these variables, it means that the average rates per property is not a relevant metric when comparing councils.
Conclusion
The City of Port Phillip council has significantly higher rates than neighbouring councils based on all relevant metrics, except average rates per residential property, which is not useful in making comparisons between councils as proven above.
Groups with vested interests will try to convince you that there is no problem with CoPP council rates. Hopefully this response explains why one shouldn’t believe such claims.
Four years later, since 2019-20, the population of CoPP has decreased from 110,624 to around 104,000 in 2024; and the total rates and charges have increased. So, it is very likely that the unitised costs have increased (for our Council total rates and charges costs per resident and total expenditure costs per resident), even if slightly offset by the introduction of the waste charge. See NOTE below. The above still holds true and current average coparisons are still not suitable.
The above analysis of financial metrics clearly shows that average rates data is false and misleading. Instead, rates data should be unitised for population differences.
For the 2023-24 financial year, CoPP rates and charges continue to be much higher compared to Stonnington, Bayside and Glen Eira for a property of the same value.
For example, the rates and charges for a house priced at $1.9M in Port Phillip are $3,483 which is $1,150 more than Stonnington, $1,000 more than Bayside and $580 more than Glen Eira. See https://ropp.org.au/property-rates-calculator/
In the above example, the State Government factual valuation of a property is used to show the rates and charges for property of that value in CoPP, along with being higher than the neighbouring properties. Average rates per property will not provide this detail.
Disclaimer:
All figures stated in this article are taken from the 2019-20 council budgets. Rates and Charges quoted include the fixed per property charges that almost all councils charge (75 of the 79 Victorian councils charge for waste services on a per property basis). NOTE: In 2022-23, the City of Port Phillip separated waste charges from rates revenue charges.
Sources:
https://www.propertyandlandtitles.vic.gov.au/valuation/council-valuations
http://www.portphillip.vic.gov.au/ICP_2017-27_COUNCIL%20PLAN_year%203_Complete.pdf
https://www.bayside.vic.gov.au/sites/default/files/council/item_10.2_-_attachment_2_-_annual_budget_2019_20.pdf
https://www.gleneira.vic.gov.au/media/4649/2019-20-annual-budget.pdf
https://www.stonnington.vic.gov.au/files/assets/public/about/corporate-documents/budget/council-adopted-budget-2019-2020.pdf
https://haveyoursay.portphillip.vic.gov.au/budget-20202021/online-budget-session-4-may


